Enhancing SAFEbuilt’s land-and-expand strategy with actionable sales and marketing analytics
SAFEbuilt was seeing significant growth as the nation’s fastest-growing community development partner, and they asked us to rewrite their growth strategy to balance the speed of their growth with their ongoing profitability. They had learned that pursuing every opportunity pushed their margins down, so they wanted a strategy that was built around landing and expanding—“landing” in a metro area and “expanding” to other municipalities, or “landing” in an account and then “expanding” to other services.
Once that strategy was built and approved, SAFEbuilt needed a way to monitor their progress toward executing it. They wanted the scoreboard used by their business development team to drive smart growth aligned with the approved strategy, not just any growth.
The Bonfire Effect team had previously helped SAFEbuilt develop their Salesforce.com and Marketo (since replaced by Pardot) ecosystem, turning Salesforce.com into the company’s central system of record for all sales and marketing data. To give SAFEbuilt a way to measure their activities and results and get the most leverage out of their CRM, we used Tableau—a leading data visualization tool—to extract the myriad data from Salesforce.com and turn it into actionable insights.
Now, with robust sales and marketing analysis, SAFEbuilt is well positioned to dial in the effectiveness of their aggressive land-and-expand growth strategy. And by keeping the numbers transparent, the whole sales team benefits from a little friendly competition.
Take a look at the various pieces that make up SAFEbuilt’s sales and marketing dashboards:
Measuring results
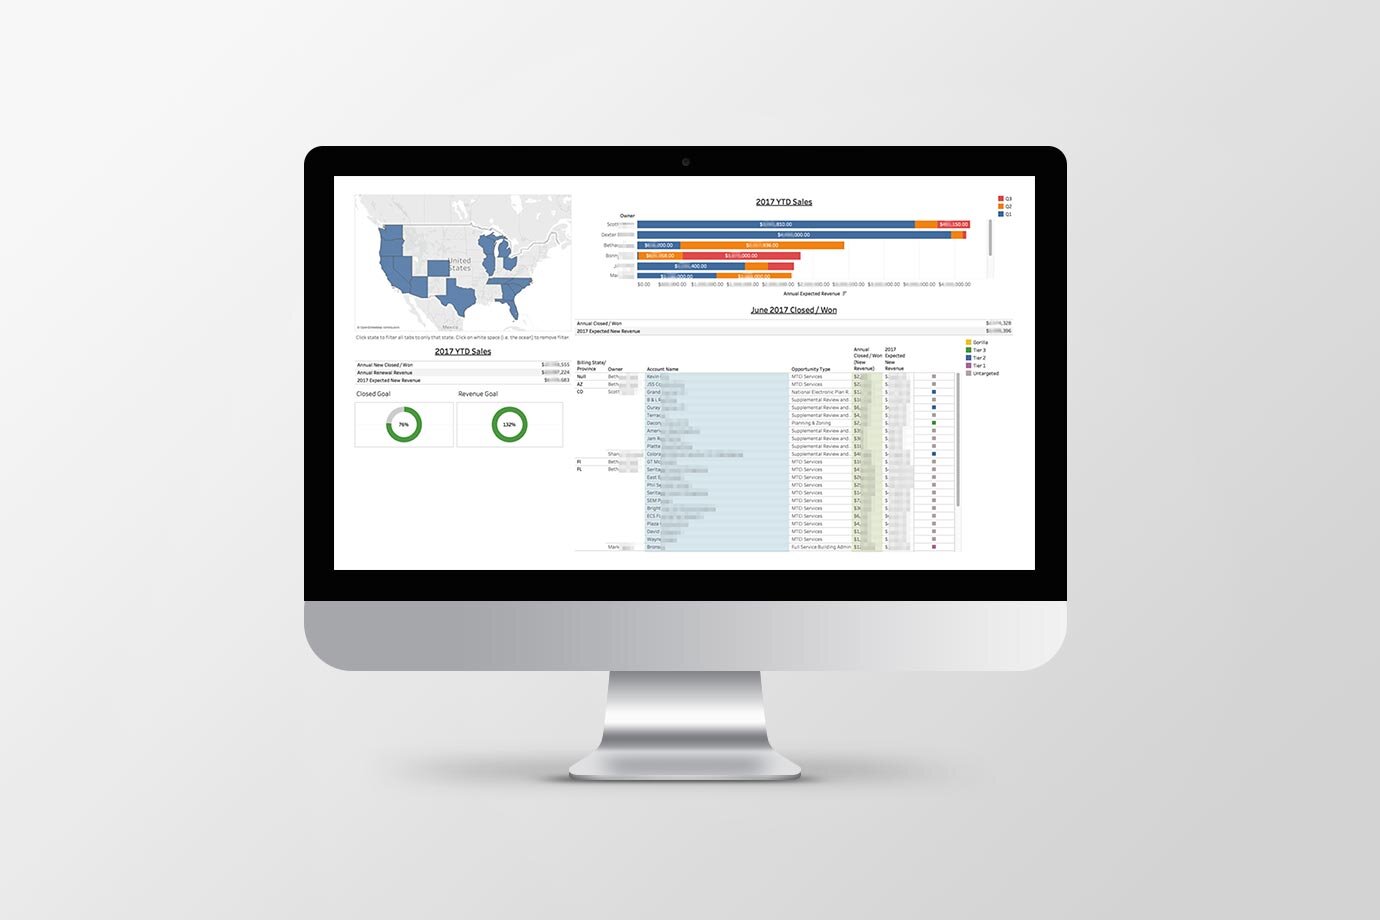
Since sales are king in business growth, SAFEbuilt needs a way to quickly understand their progress toward their sales goals as a company and within each of their state territories. Their Results Dashboard gives them rapid insight into “closed/won” deals with:
Quick filtering by state by using a graphic U.S. map
High-level sales numbers, showing total recurring revenue values and estimated FY revenue impacts
Easy-to-understand “% of goal” dials for total sales and FY revenue
Sales by sales person and quarter
List of all deals won in the previous month
Measuring activity
While the actual sales results are most important for the majority of business discussions, understanding (and enforcing) a proven way of getting those results is one secret of companies that see sustained growth over time. SAFEbuilt uses an Activity Dashboard to measure their sales activity with:
High-level pipeline numbers, showing total potential sales and FY revenue as well as “weighted” versions of those numbers (based on the “probability” of each opportunity as calculated by Salesforce.com using Bonfire’s regression analysis)
Graphical analysis of “fee type” and “service line” makeups of the pipeline, representing two strategic initiatives of the company
Engagement percentages for targeted Gorilla, Tier 1, and Tier 2 accounts—buckets that SAFEbuilt uses in the account-based marketing (ABM) strategy built by Bonfire
Current pipelines by sales person and by opportunity stage
The five largest opportunities by state territory, providing a snapshot of the deals on which the sales team should likely focus
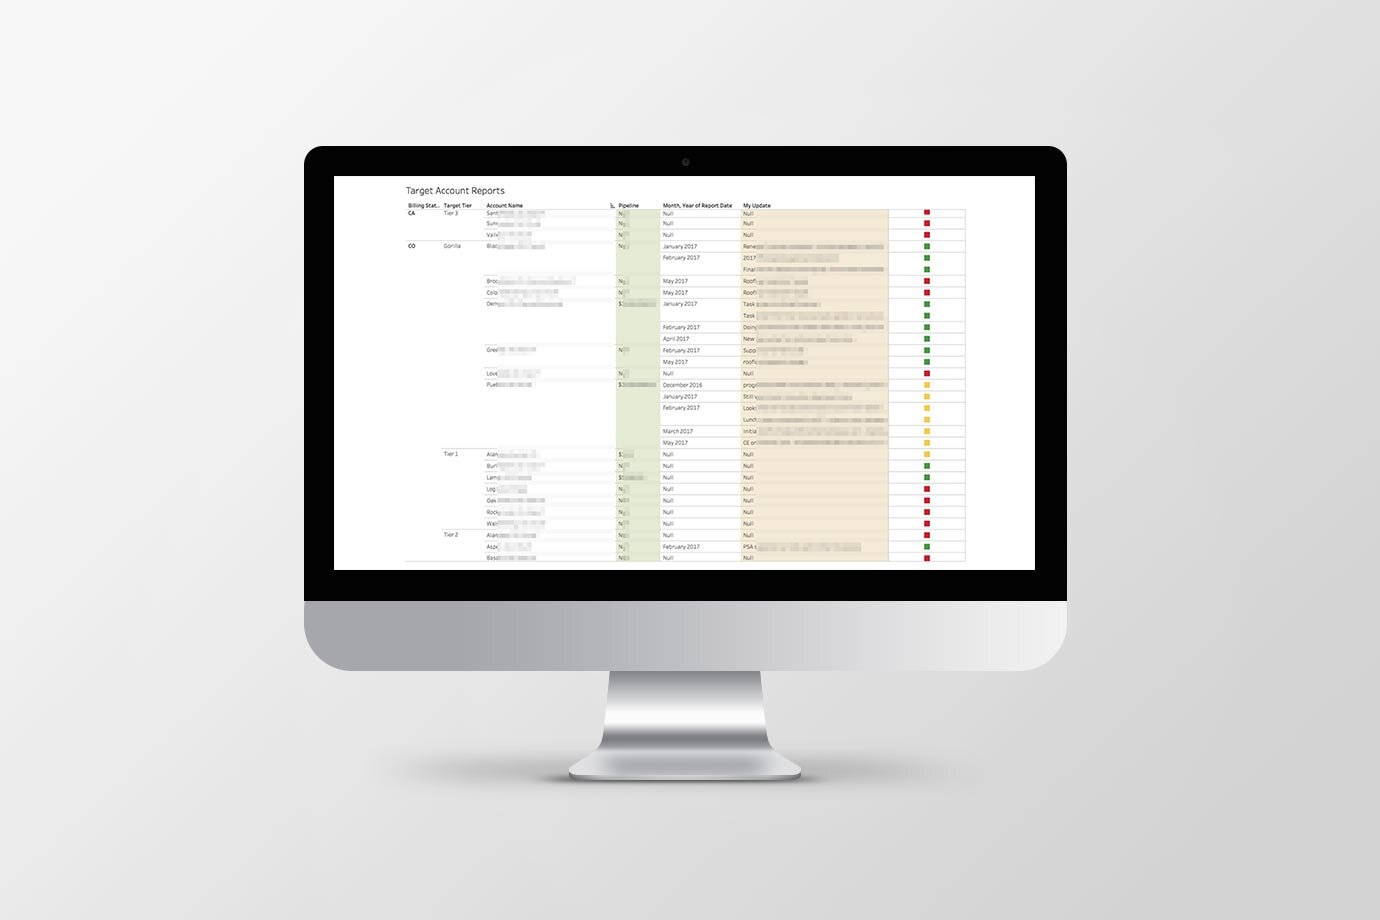
Account-based reporting
In order to focus the SAFEbuilt sales team on their targeted accounts, Bonfire has developed functionality in Salesforce.com to submit short account-specific status updates. These updates flow into a Target Account Report reviewed by company leadership. It shows the updates, grouped by state, for the past 12 months. It also shows (via colored square) a quick snapshot to understand which accounts have current contracts (green), are current opportunities (yellow), or are unengaged (red).
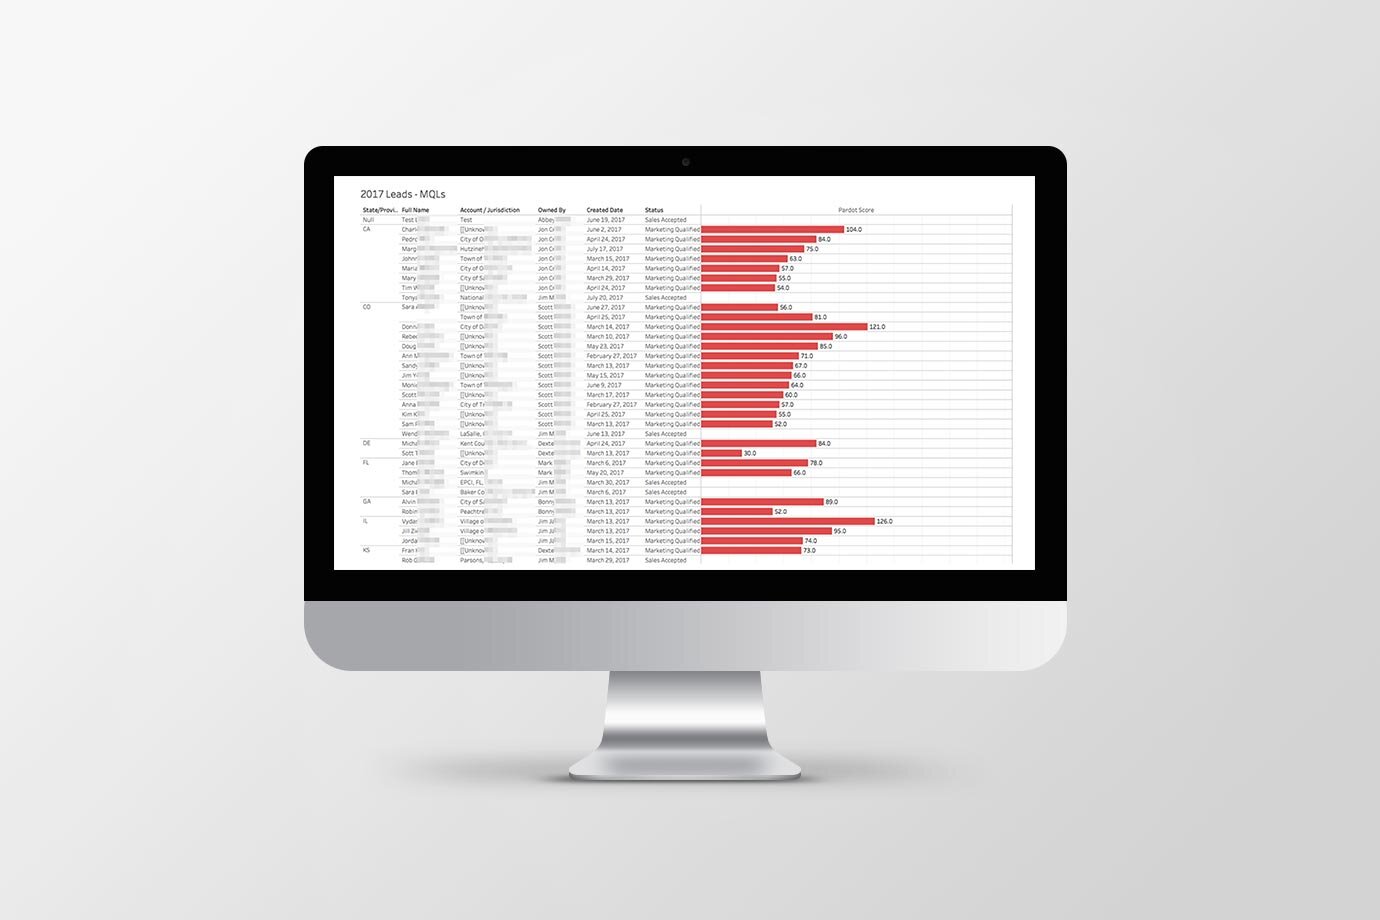
Monitoring Marketing and Lead Sources
With SAFEbuilt’s major shift in marketing strategy away from mass media and events and toward targeted digital outreach, it is important to be able to measure the effectiveness of marketing campaigns. Company leaders also want to understand which marketing activities target each state territory. The Campaigns Report accomplishes this for company leaders while the Leads Report helps identify top leads that the company should engage and indicates whether or not the assigned sales person is following up appropriately.
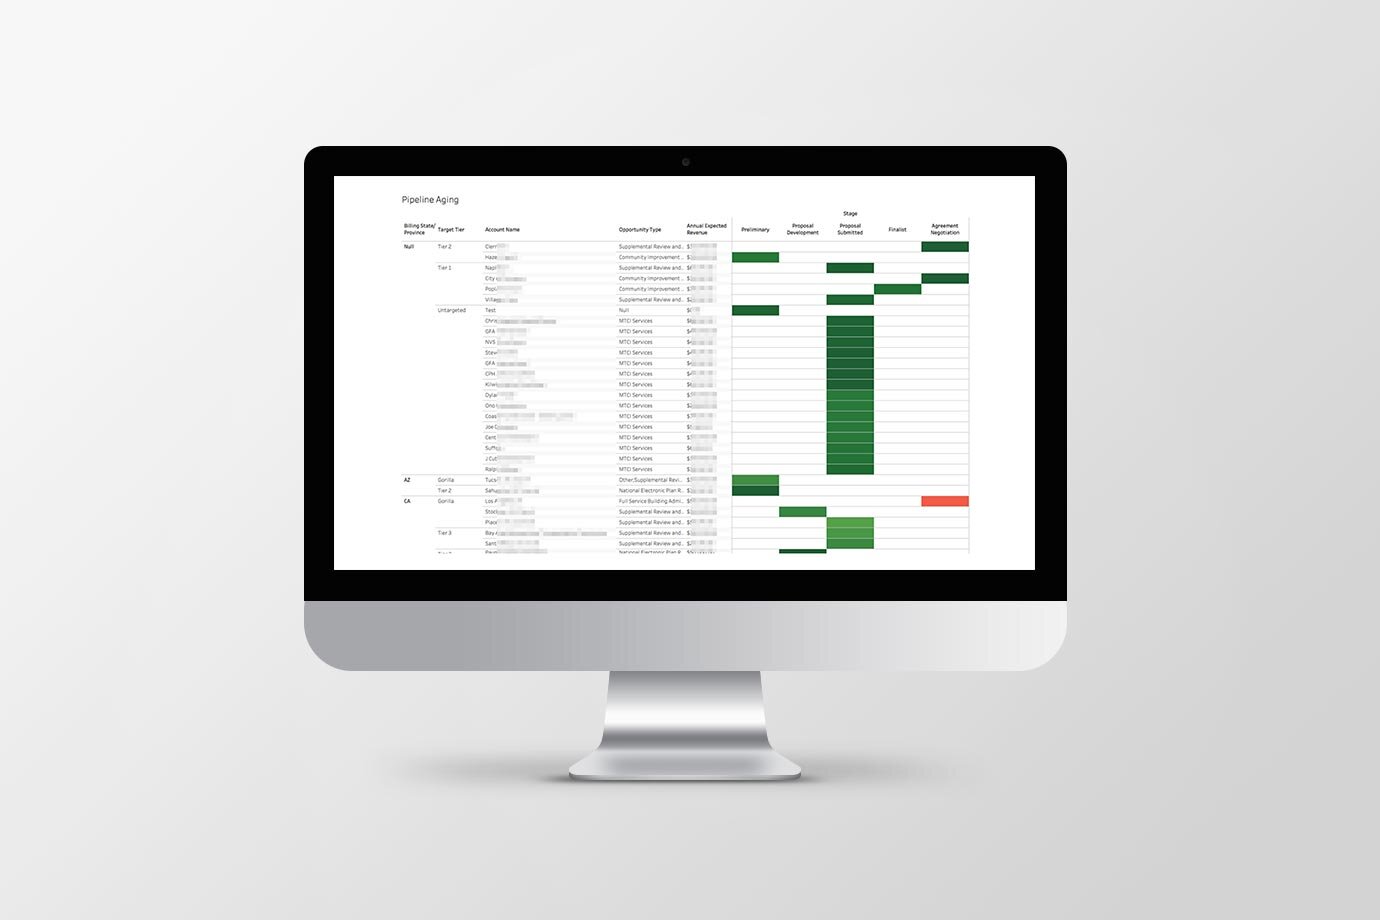
Fountain of youth
When it comes to sales opportunities, the likelihood of closing a deal drops as the opportunity gets older. In order to identify stale opportunities that might be artificially inflating SAFEbuilt’s sales pipeline (and, with it, its revenue forecasts), Bonfire uses the Pipeline Agingreport. The colored boxes indicate age (green = young; red = old), and the location of the box along the x-axis indicates the stage of the opportunity as it moves toward closing. A red box in the “Preliminary” stage is a major red flag; whereas, one in the “Agreement Negotiation” stage may not indicate anything alarming.